Vytrac
Doctors see at a glance whether a patient is getting better.

- Role
- Lead UI/UX Designer, Product Design Consultant
- Platform
- Web and mobile, for providers and patients
- Software
- Figma, FigJam, Dev Mode
- Design system
- One component library for the provider and patient apps on web and mobile: a teal brand, colour-coded alert levels and an icon for every vital
Try the prototype
A remote patient monitoring platform for care teams, built from the Figma board. Work through today's to-do cases, read any vital on the chart, adjust a patient's alert thresholds, and follow an alert from the dashboard to the patient's timeline and health report.
Pick a patient in the left list, switch vitals in the chart tabs and hover the lines to read them. The top menu opens the patient list, messages and calendar.
Best on a laptop or desktop screen.
The problem
Clinicians monitoring patients remotely had symptom readings spread across screens, with no quick way to tell whether someone was improving or declining.
Features
- ·Built around an AI engine that tracks and monitors patient health, with AI insights, symptom trends and model confidence shown to clinicians
- ·Interactive prototypes of the provider and patient flows: triage cards, the vitals timeline and guided readings
- ·534 full screens in Figma: 282 web and 98 mobile for providers, 49 web and 105 mobile for patients, not counting dialogs and states
- ·Provider dashboard: today's patients, to-do cards and a vitals timeline for each
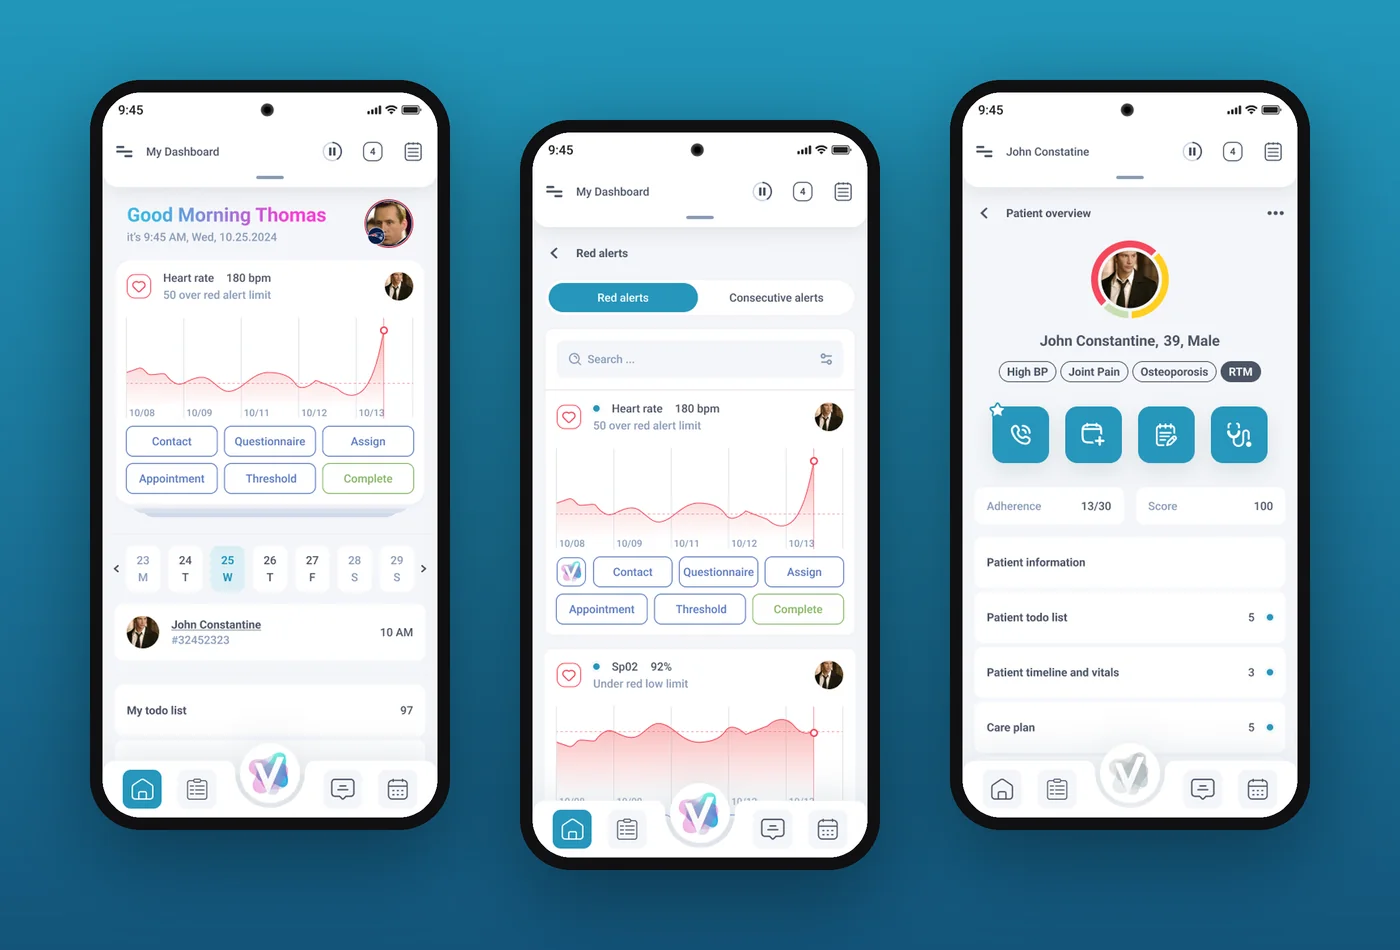
- ·Red, yellow and consecutive alerts with actions: contact, questionnaire, assign, adjust threshold
- ·Patient profile with care plan, team notes, encounters, goal thresholds, documents and tickets
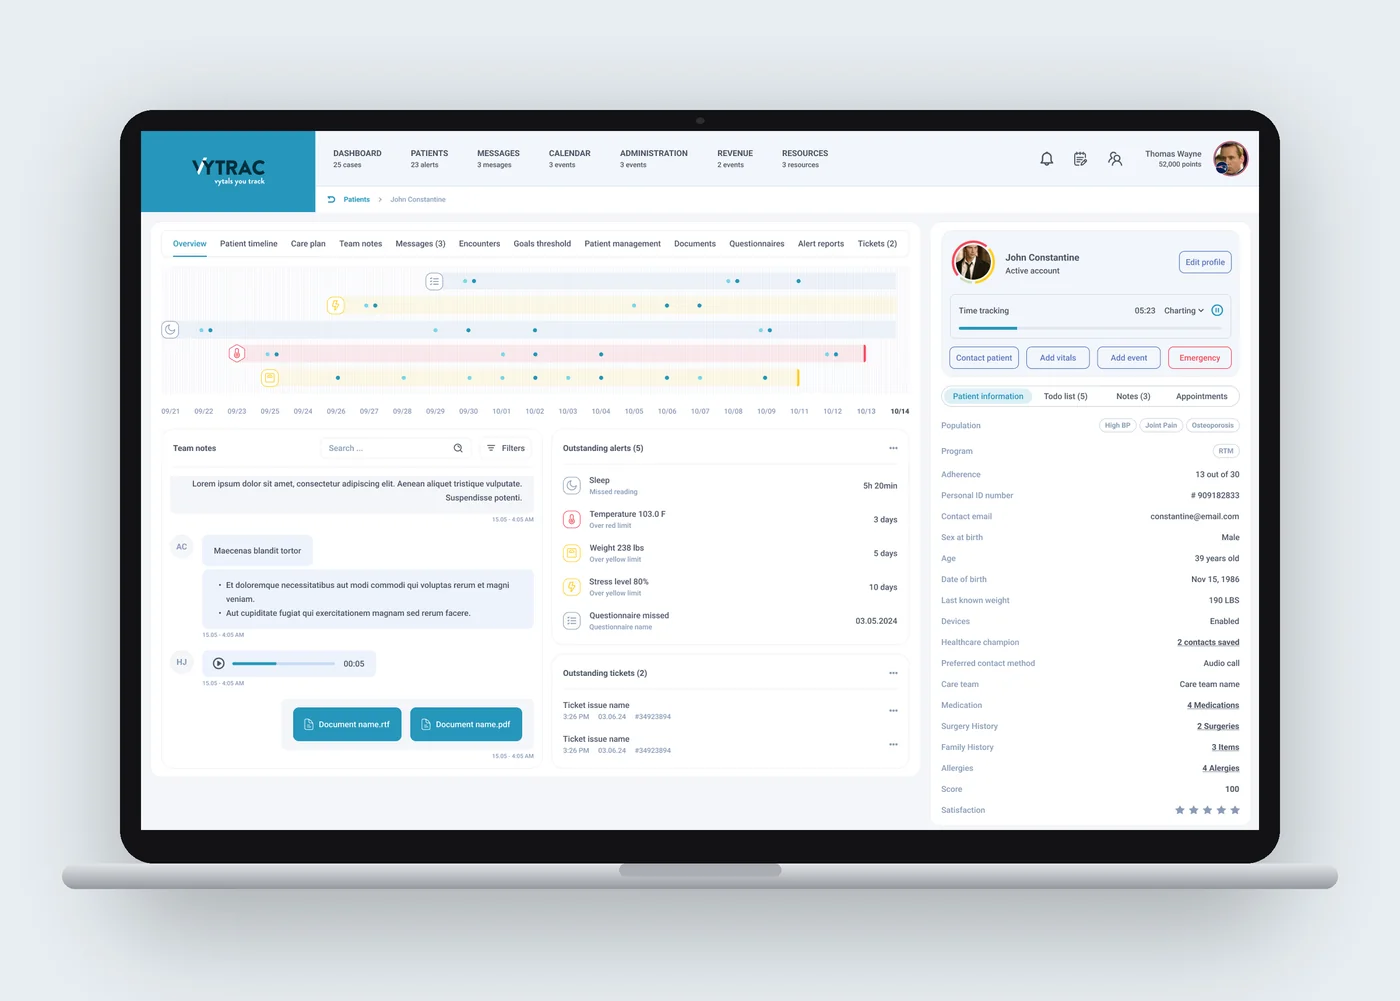
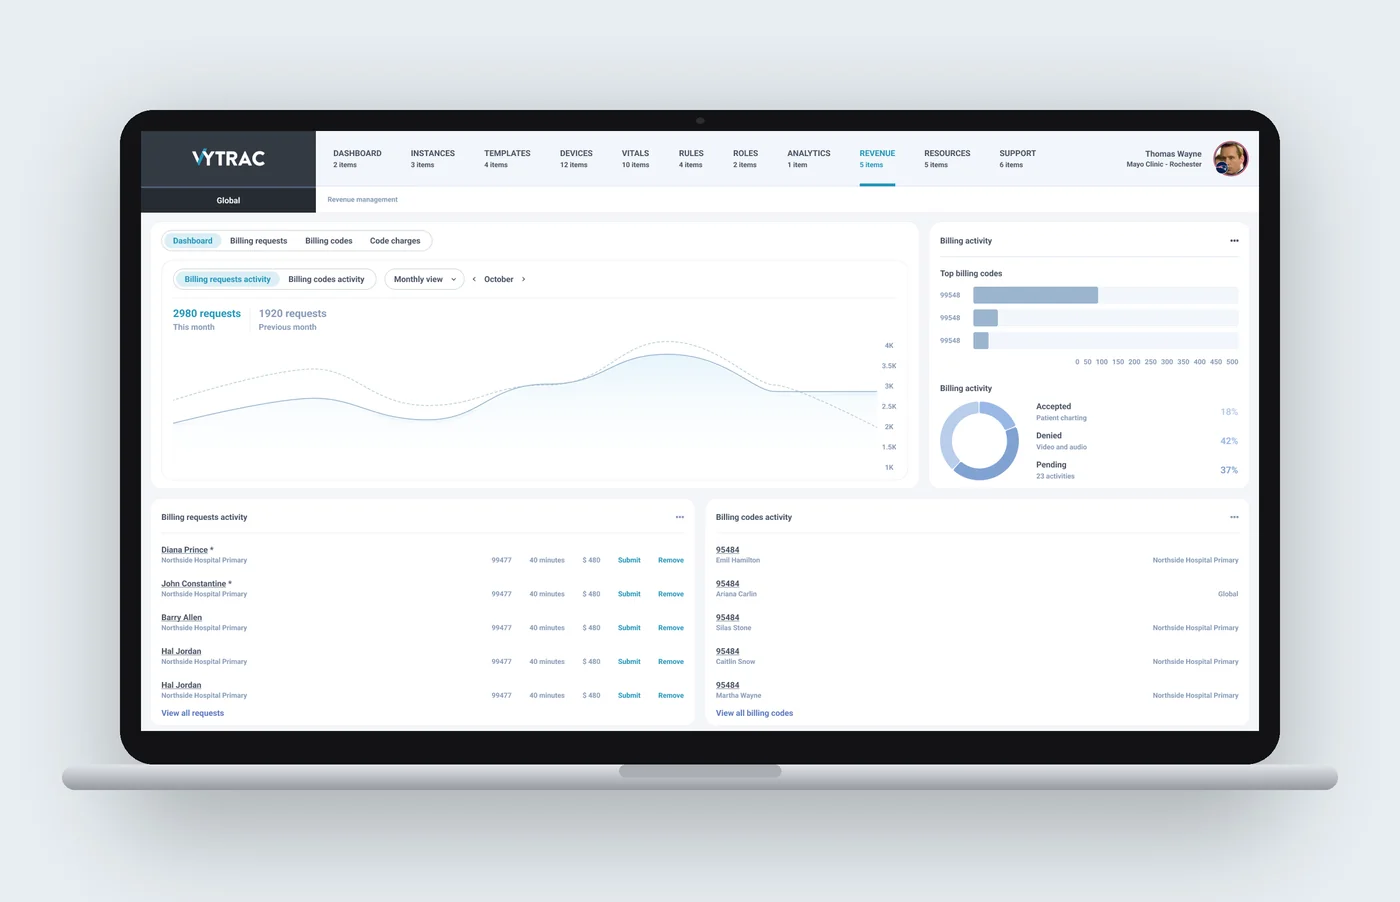
- ·Time tracking while charting, feeding revenue management and billing codes
- ·Analytics for adherence, alerts, staff response, usage and billing
- ·Clinic administration: tenants, roles, rules engine, devices and vitals settings
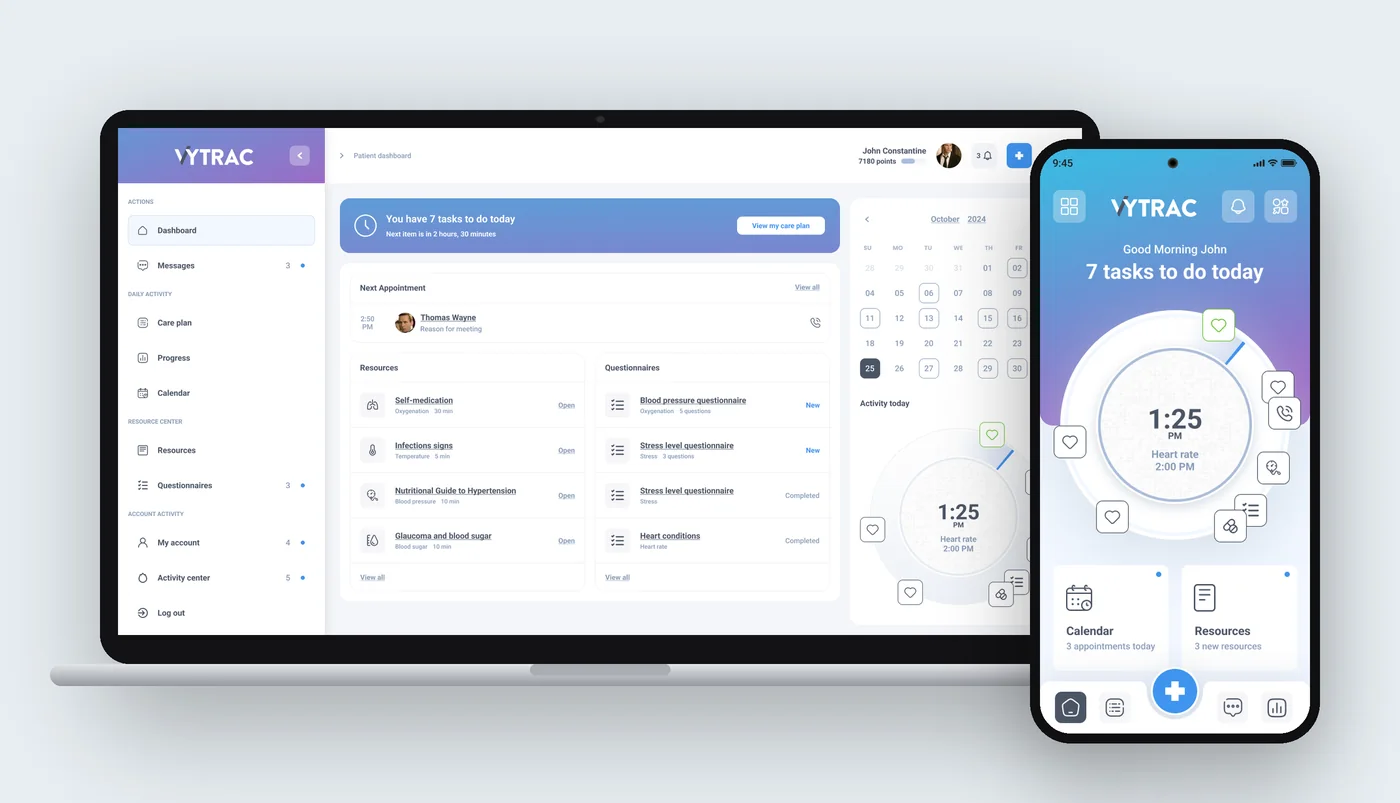
- ·Patient app: daily tasks, guided vital readings and progress for each vital
Approach
- 01
Scope
ProblemRemote patient monitoring has very different users: providers and care teams, clinic administrators, and patients at home.
SolutionSplit the product into a provider platform and a patient platform, each on web and mobile, built from one shared component library. Clinic administration lives inside the provider platform.
- 02
Triage
ProblemA provider starts the day with many patients and readings, and needs to know who needs attention first.
SolutionThe dashboard lists today's patients with their open items. Each patient opens as to-do cards, such as a heart rate 50 over the red alert limit, with the next actions on the card: contact patient, provide questionnaire, assign, request appointment, adjust threshold or complete.
- 03
Trends at a glance
ProblemReadings spread across screens made it hard to tell whether a patient was getting better or worse.
SolutionA timeline gives every vital its own lane over several weeks and marks where readings crossed a limit. Tabs switch between blood pressure, heart rate, blood sugar, weight, sleep and the other vitals.
- 04
Patient record
ProblemCare teams needed the full picture of a patient without jumping between tools.
SolutionThe patient profile groups the timeline, care plan, team notes, messages, encounters, goal thresholds, documents, questionnaires, alert reports and tickets in tabs, next to a panel with conditions, program, adherence, devices and a timer for charting.
- 05
Revenue and analytics
ProblemClinics needed to turn monitoring work into billing and to see how their teams respond.
SolutionTime tracked while charting feeds revenue management, where billing requests move from ready to submitted to approved, and billing codes carry their own rules and modifiers. Analytics cover adherence, alerts, staff response, usage and billing.
- 06
Provider mobile
ProblemAlerts arrive when providers are away from their desks.
SolutionThe provider app keeps the dashboard's alert cards and actions, and a patient overview with quick actions to call, book, add notes and record vitals.
- 07
Patient app
ProblemPatients need to know what to do today, without clinical jargon.
SolutionThe patient home opens with today's tasks around an activity clock. Taking a reading is guided step by step, and each vital has its own progress view with recent results.



Design library
- Primary highlight#2696BBBrand, active tabs and toggles
- Primary text#4B5565Text, normal alerts
- Secondary highlight#899BB7Secondary text, missed readings
- Link#5B79C0Links, action buttons
- Red alert#F5485CHigh-risk alerts, emergency
- Yellow alert#FFCE20Medium-risk alerts
- Completed green#75C16ECompleted items, confirmation
- Escalated#9781B2Escalated encounters
- Missed call#DD834DMissed calls
- Toggle selection#DBEFF5Selected toggle background
- Normal alert#DEE9F5Normal readings, timeline lanes
- Page background#F4F6FAPage background
- Patient name · 16/500John Constantine
- Body · 14/400Active account
- Body medium · 14/500All cases
- Link · 14/700Go to patient profile
- Tag · 12/700Escalated
- Caption · 12/400Male · 39 years · 190 lbs
Vital alert icon
One icon per vital, in five alert levels: normal, missed reading, yellow and red limits, and critical, which changes shape as well as colour.


- Alert icon
- Frame and colour
Status tag
The state of an encounter or call in lists and the encounter history.
- Tag
- Label
Action button
The actions on a patient's to-do card. Colour says what kind of action it is; pressed fills it.
- Button
- Label
Case toggle
Switches the dashboard between the provider's own cases and all cases; the secondary style sits in tab rows.
- Toggle group
- Selected option
- Option