Designing a career achievement tracker: ProLog
Real-time tracking of every professional achievement, in one timeline. How the careers web app was designed, phase by phase.
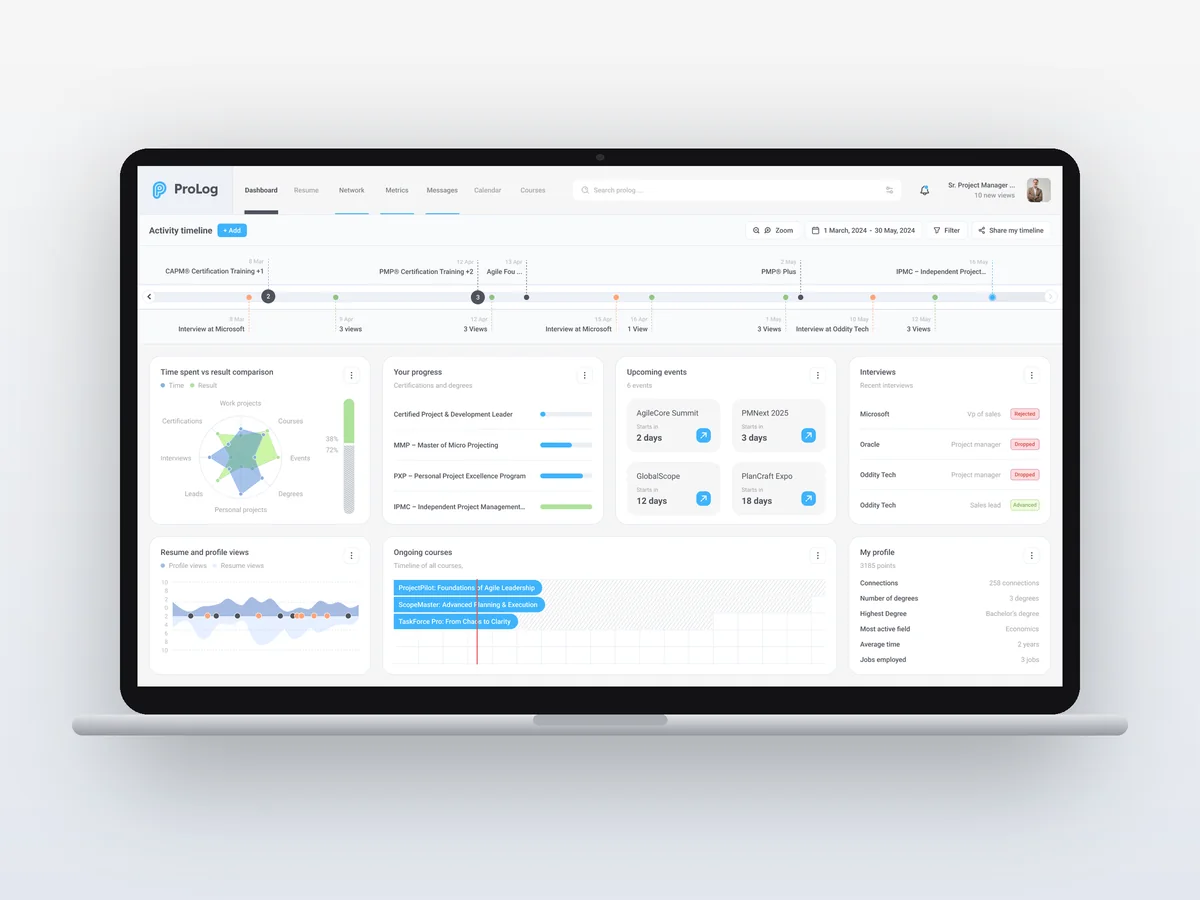
Real-time tracking of every professional achievement, in one timeline.
Project at a glance
- Product: ProLog, a careers web app
- Platform: Web
- Software: Figma
- Design system: Light and dark themes with sky blue and green accents
The challenge
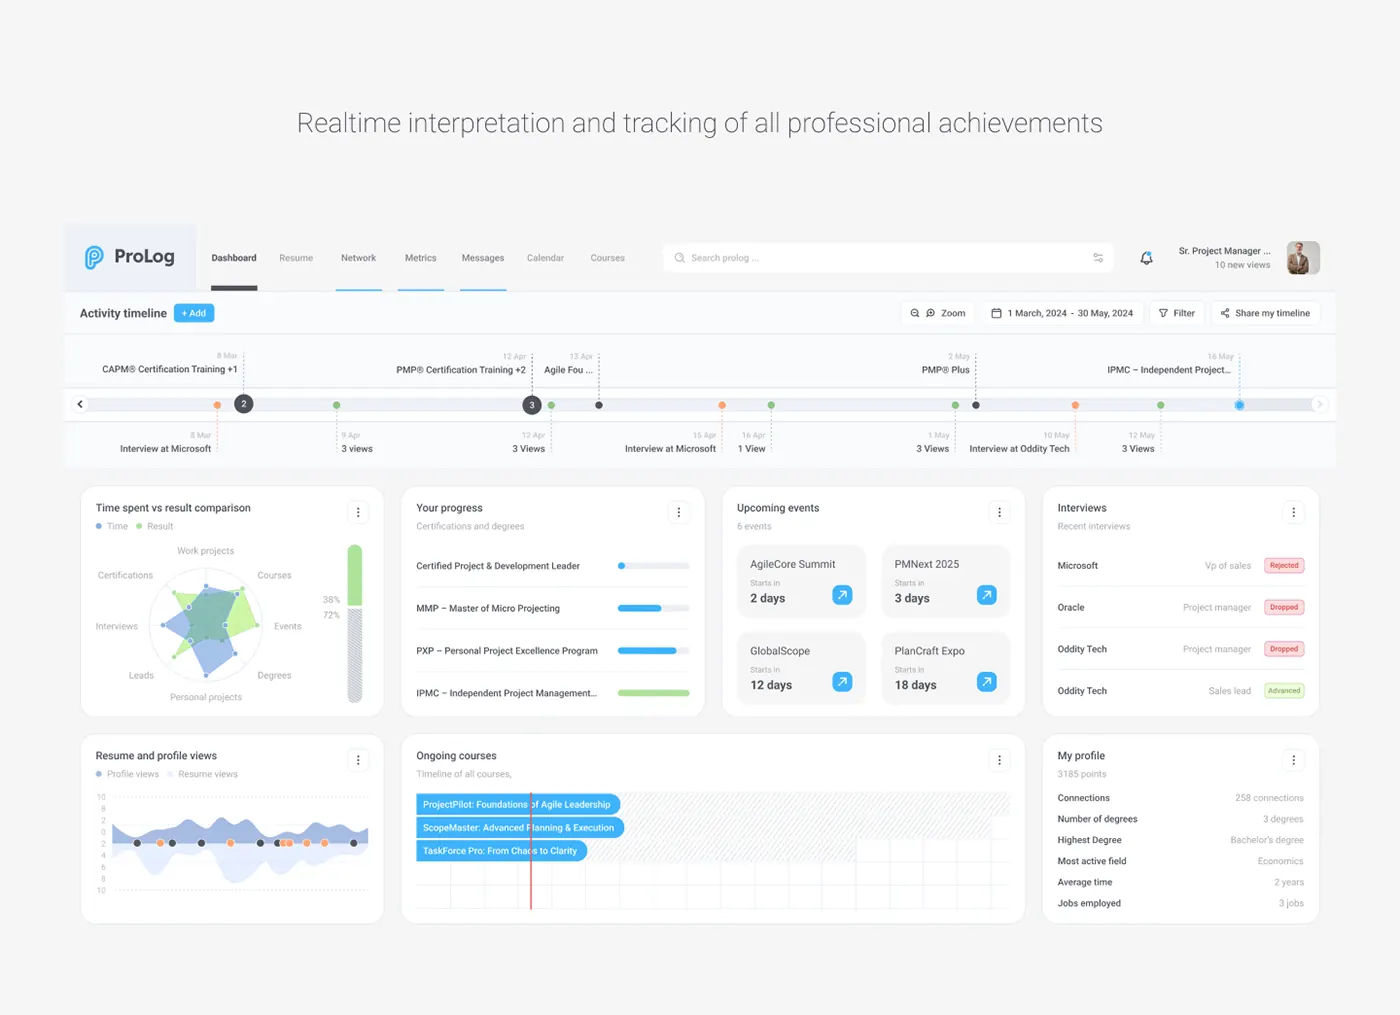
Keeping track of everything that helps your career was becoming far too cumbersome.
Certifications, courses, interviews, events and profile views usually live in different places. ProLog brings them into one dashboard, so a career reads like a story instead of a pile of tabs.
The UX approach
The work moved through five phases: problem framing, the activity timeline, dashboard cards, time versus results, and light and dark themes. The flows were tried out in an interactive prototype before the final UI.
1. Problem framing
The problem. Certifications, courses, interviews and profile views sit in separate places, so keeping track of a career becomes cumbersome.
The solution. Set out to bring every professional activity into one dashboard that updates as things happen.
2. Activity timeline
The problem. A plain list of events hides how they relate to each other over time.
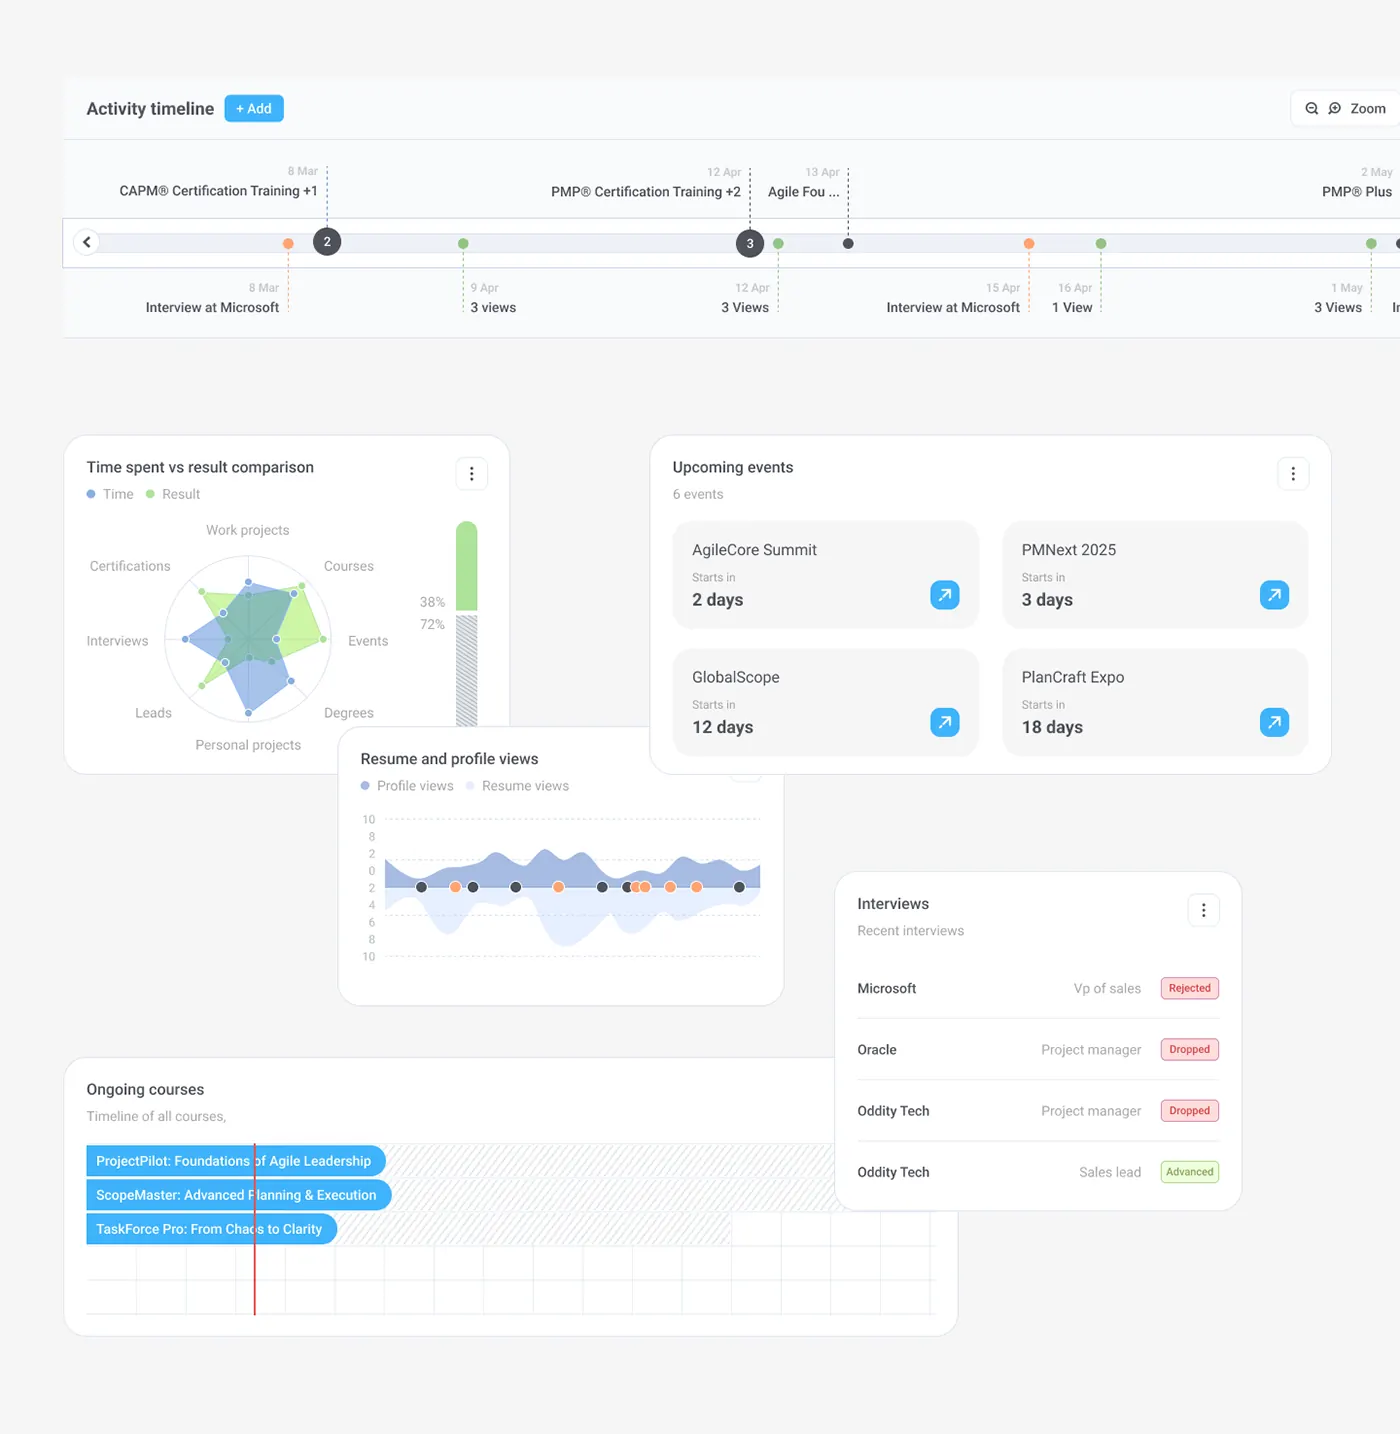
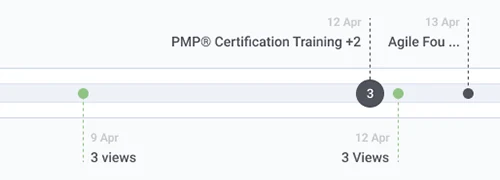
The solution. Placed a zoomable, filterable activity timeline across the top, with colour-coded markers and numbered clusters. "Share my timeline" makes it easy to send.
3. Dashboard cards
The problem. Each type of activity needs to be read differently: progress, dates or outcomes.
The solution. Split the dashboard into cards: certification progress bars, event countdowns, interviews tagged Rejected, Dropped or Advanced, and courses on a Gantt-style timeline.
4. Time vs results
The problem. It was hard to tell whether the time spent on courses, events or projects was paying off.
The solution. Added a radar chart comparing time with results across eight areas, next to a chart of resume and profile views.
5. Light and dark
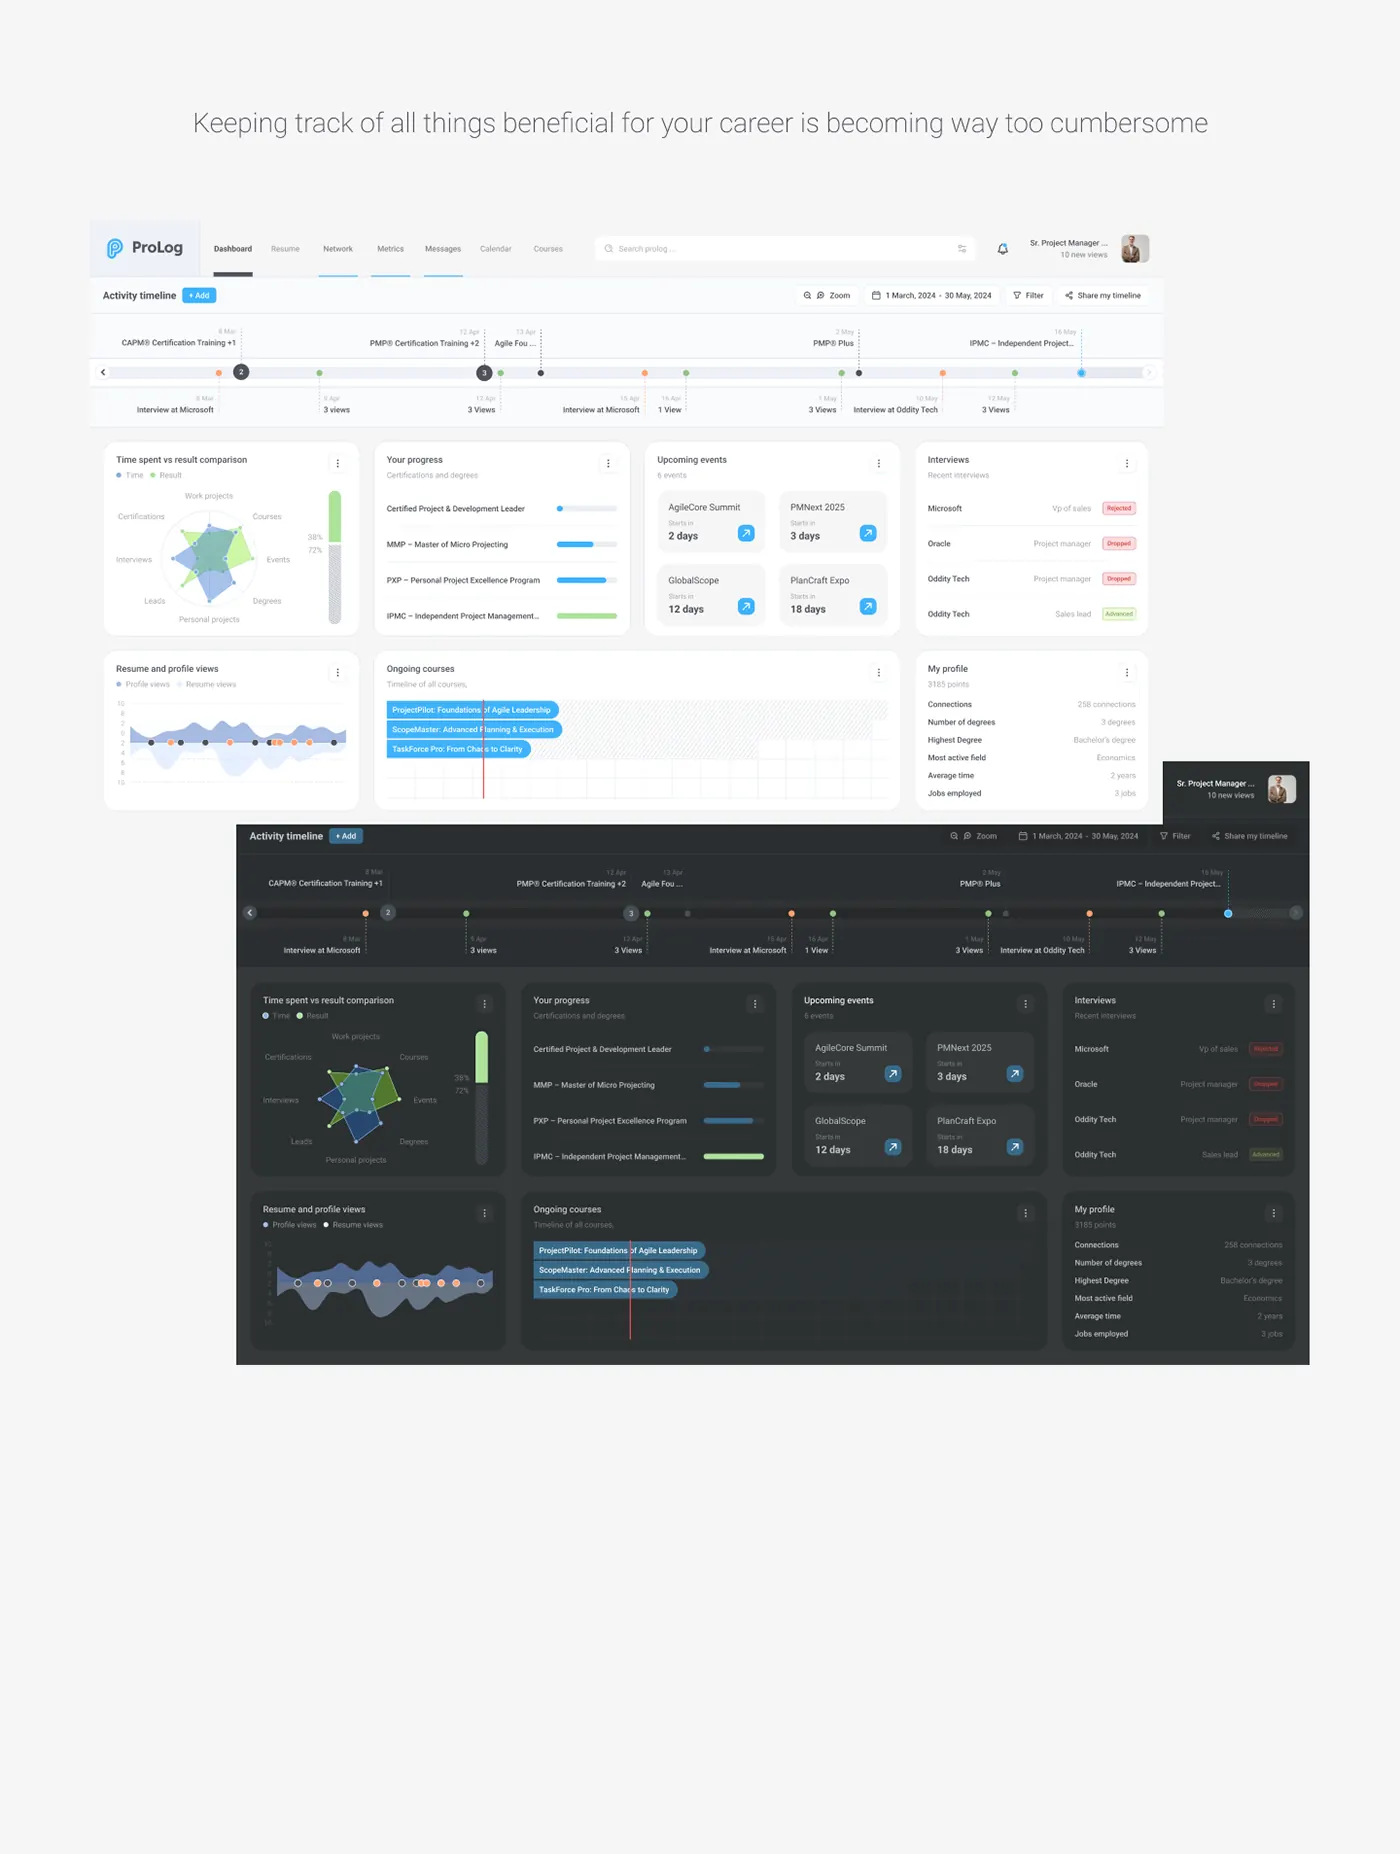
The problem. A dense, data-heavy screen had to stay legible in both light and dark themes.
The solution. Built both themes from the same layout, keeping the sky blue and green accents and the status colours consistent.
6. Beyond the dashboard
The problem. The timeline showed what happened, but people also needed to act on it: send a resume, plan the month, and check what was working.
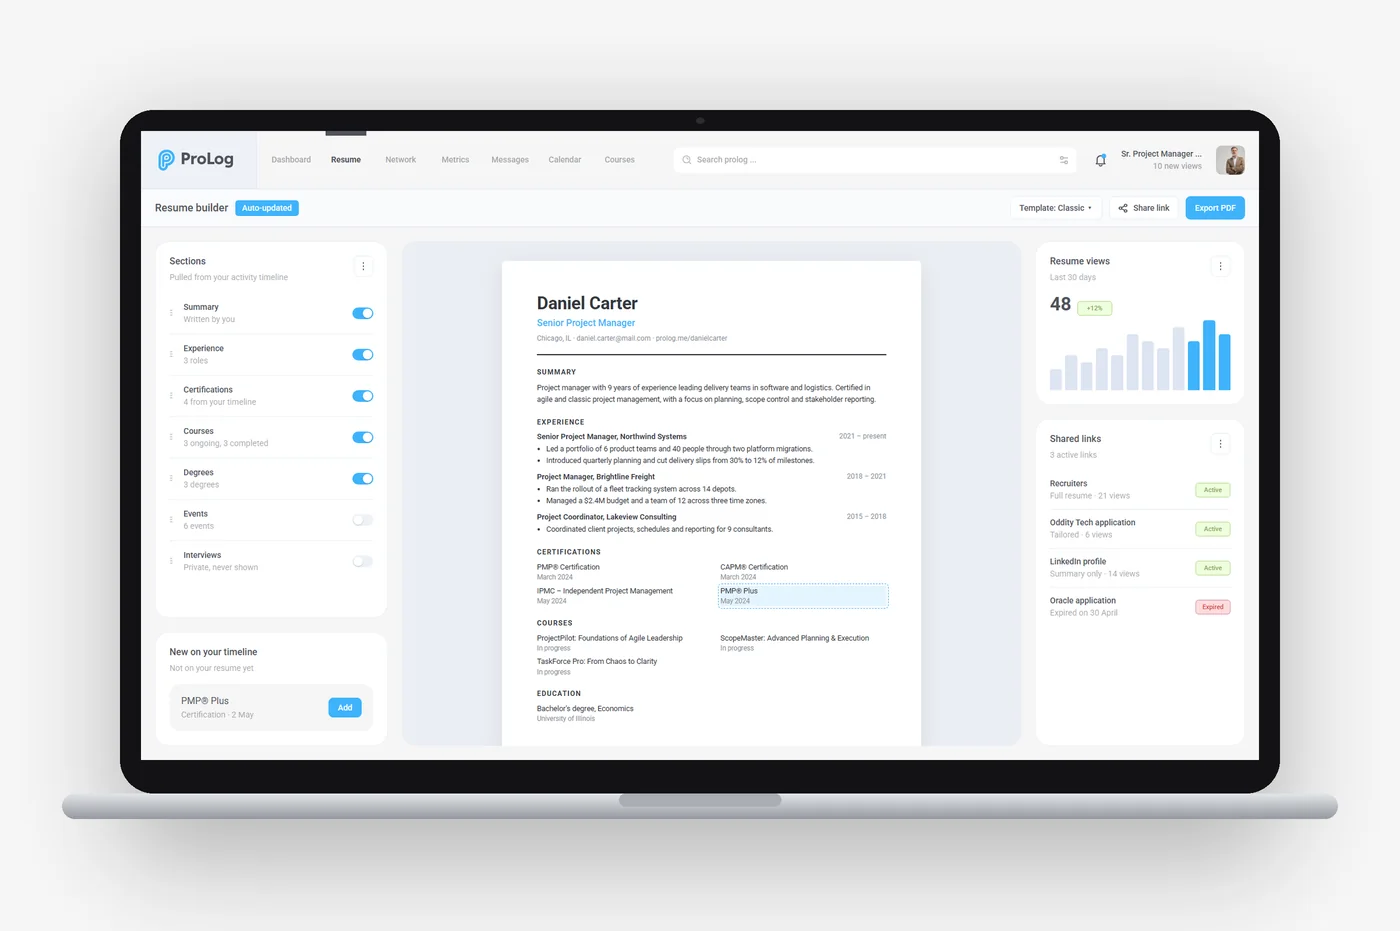
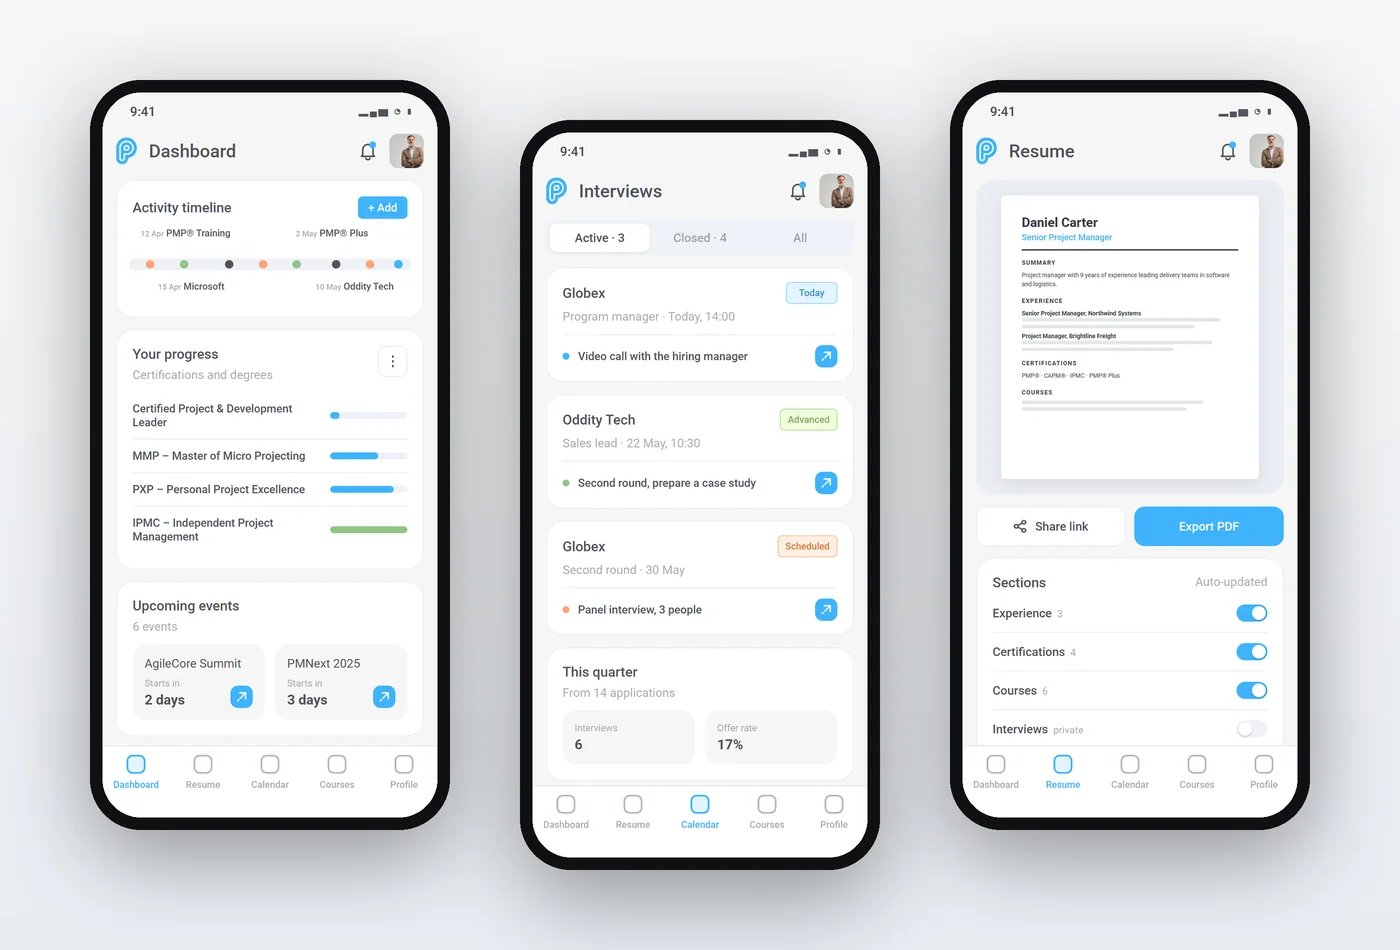
The solution. Later screens extend the same system: a resume builder that pulls sections from the timeline, a calendar that puts interviews, courses and events side by side, a metrics page with an interview funnel, and a phone version of the dashboard, interviews and resume.
What the product does
- Shareable activity timeline
- Certification and course progress
- Interview tracker and calendar
- Resume builder fed by the timeline
- Metrics: interview funnel, profile views and time spent
- Profile and resume views, on web and phone
The design system
Light and dark themes with sky blue and green accents. The design library on the project page rebuilds the timeline marker, certification progress row, event countdown card and interview status row as components with their variants.
The outcome
An interactive prototype of the activity timeline, the resume builder and interview tracking, with the full UI designed in light and dark themes.
Questions about this work? Let’s talk it through.
Set a meeting