Why complicated screens hurt retention in fintech apps, and how to simplify them
Dense fintech screens make people hesitate, and hesitation turns into drop-off. Do’s and don’ts for money flows, charts, colour and dashboards, from real products.
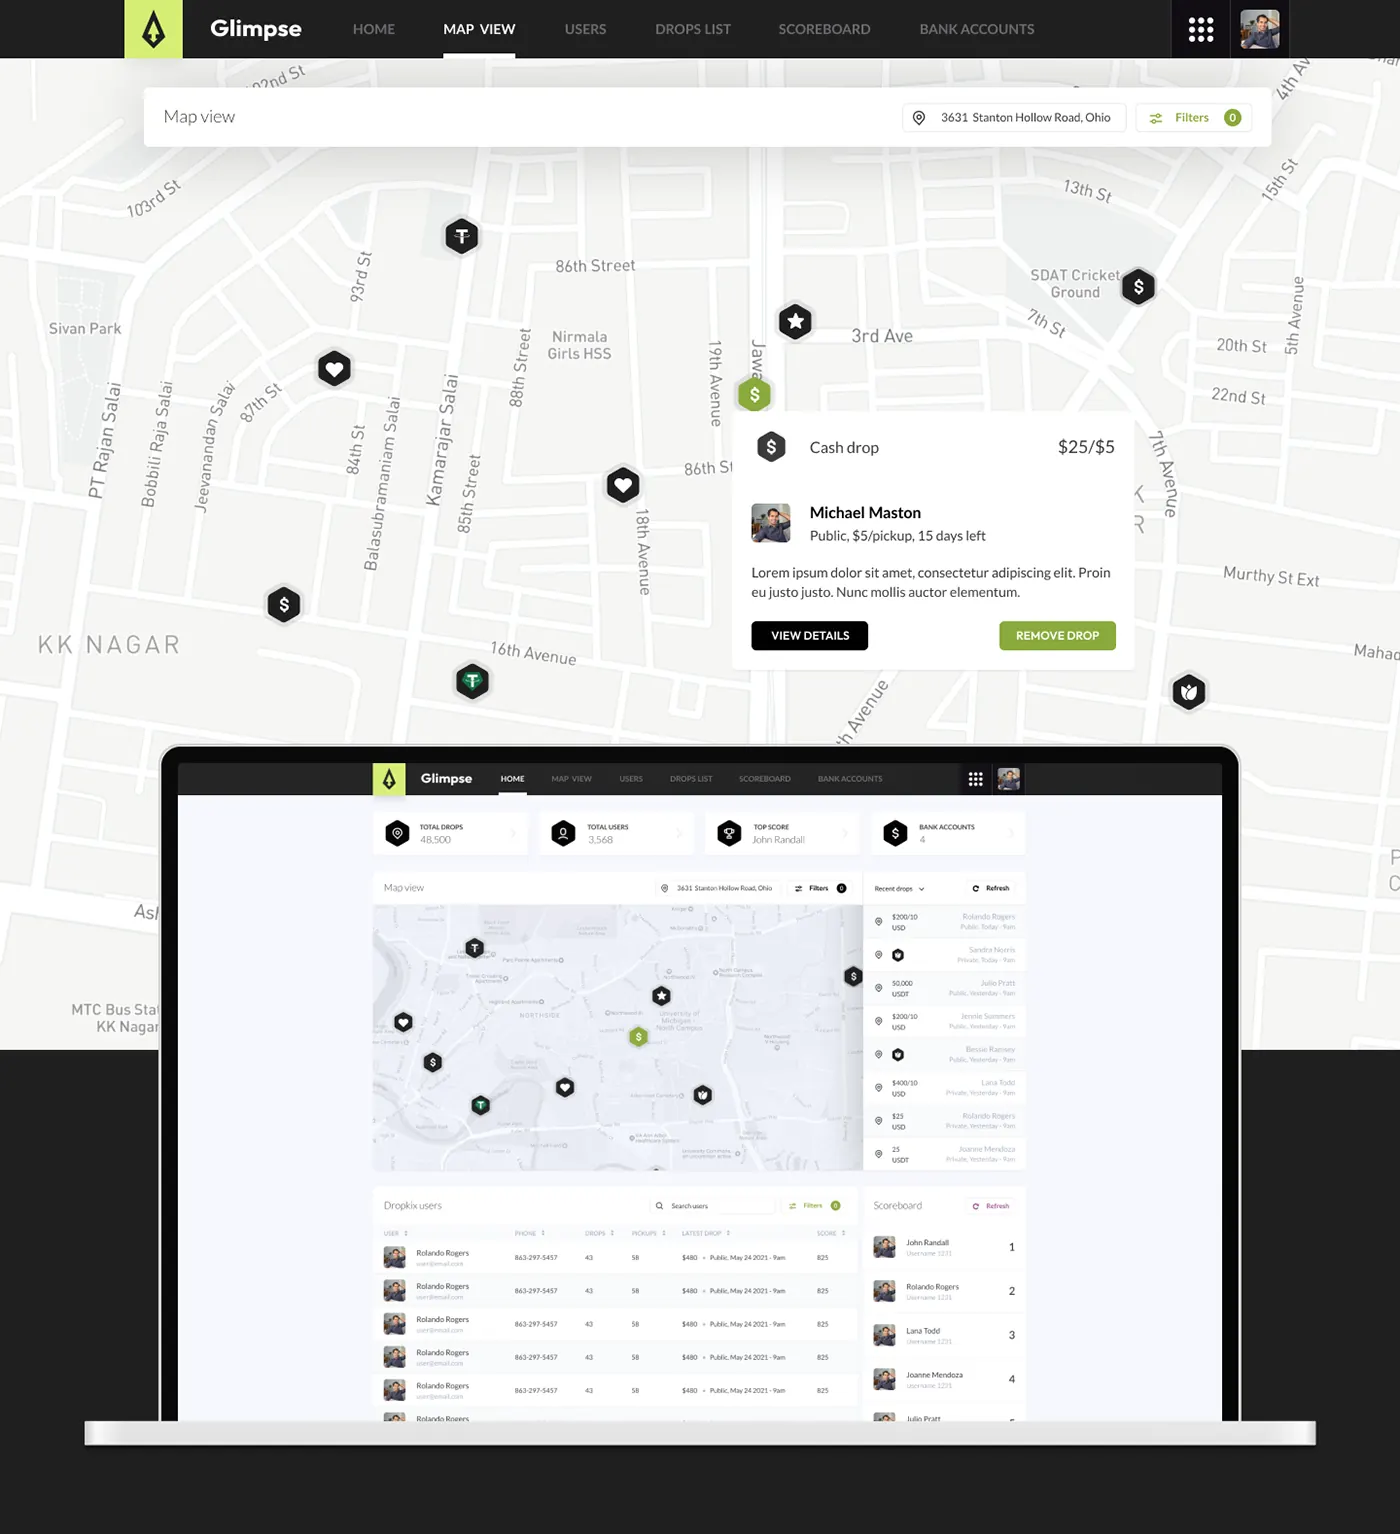
Every fintech screen carries some anxiety: is this the right amount, did it go through? A complicated screen adds to it, people hesitate, and eventually they stop opening the app. These do’s and don’ts come from fintech and data-heavy products I’ve designed, including fintech work as design lead at Crowdbotics and Glimpse, a crypto rewards app. Across Glimpse, Orbitra, Sunlight and ThutoTime, the design work lifted retention by 20–35% and conversion by up to 50%.
Make moving money deliberate
Don’t: put a one-tap confirm where people scroll, or end a payment on a vague “Done”.
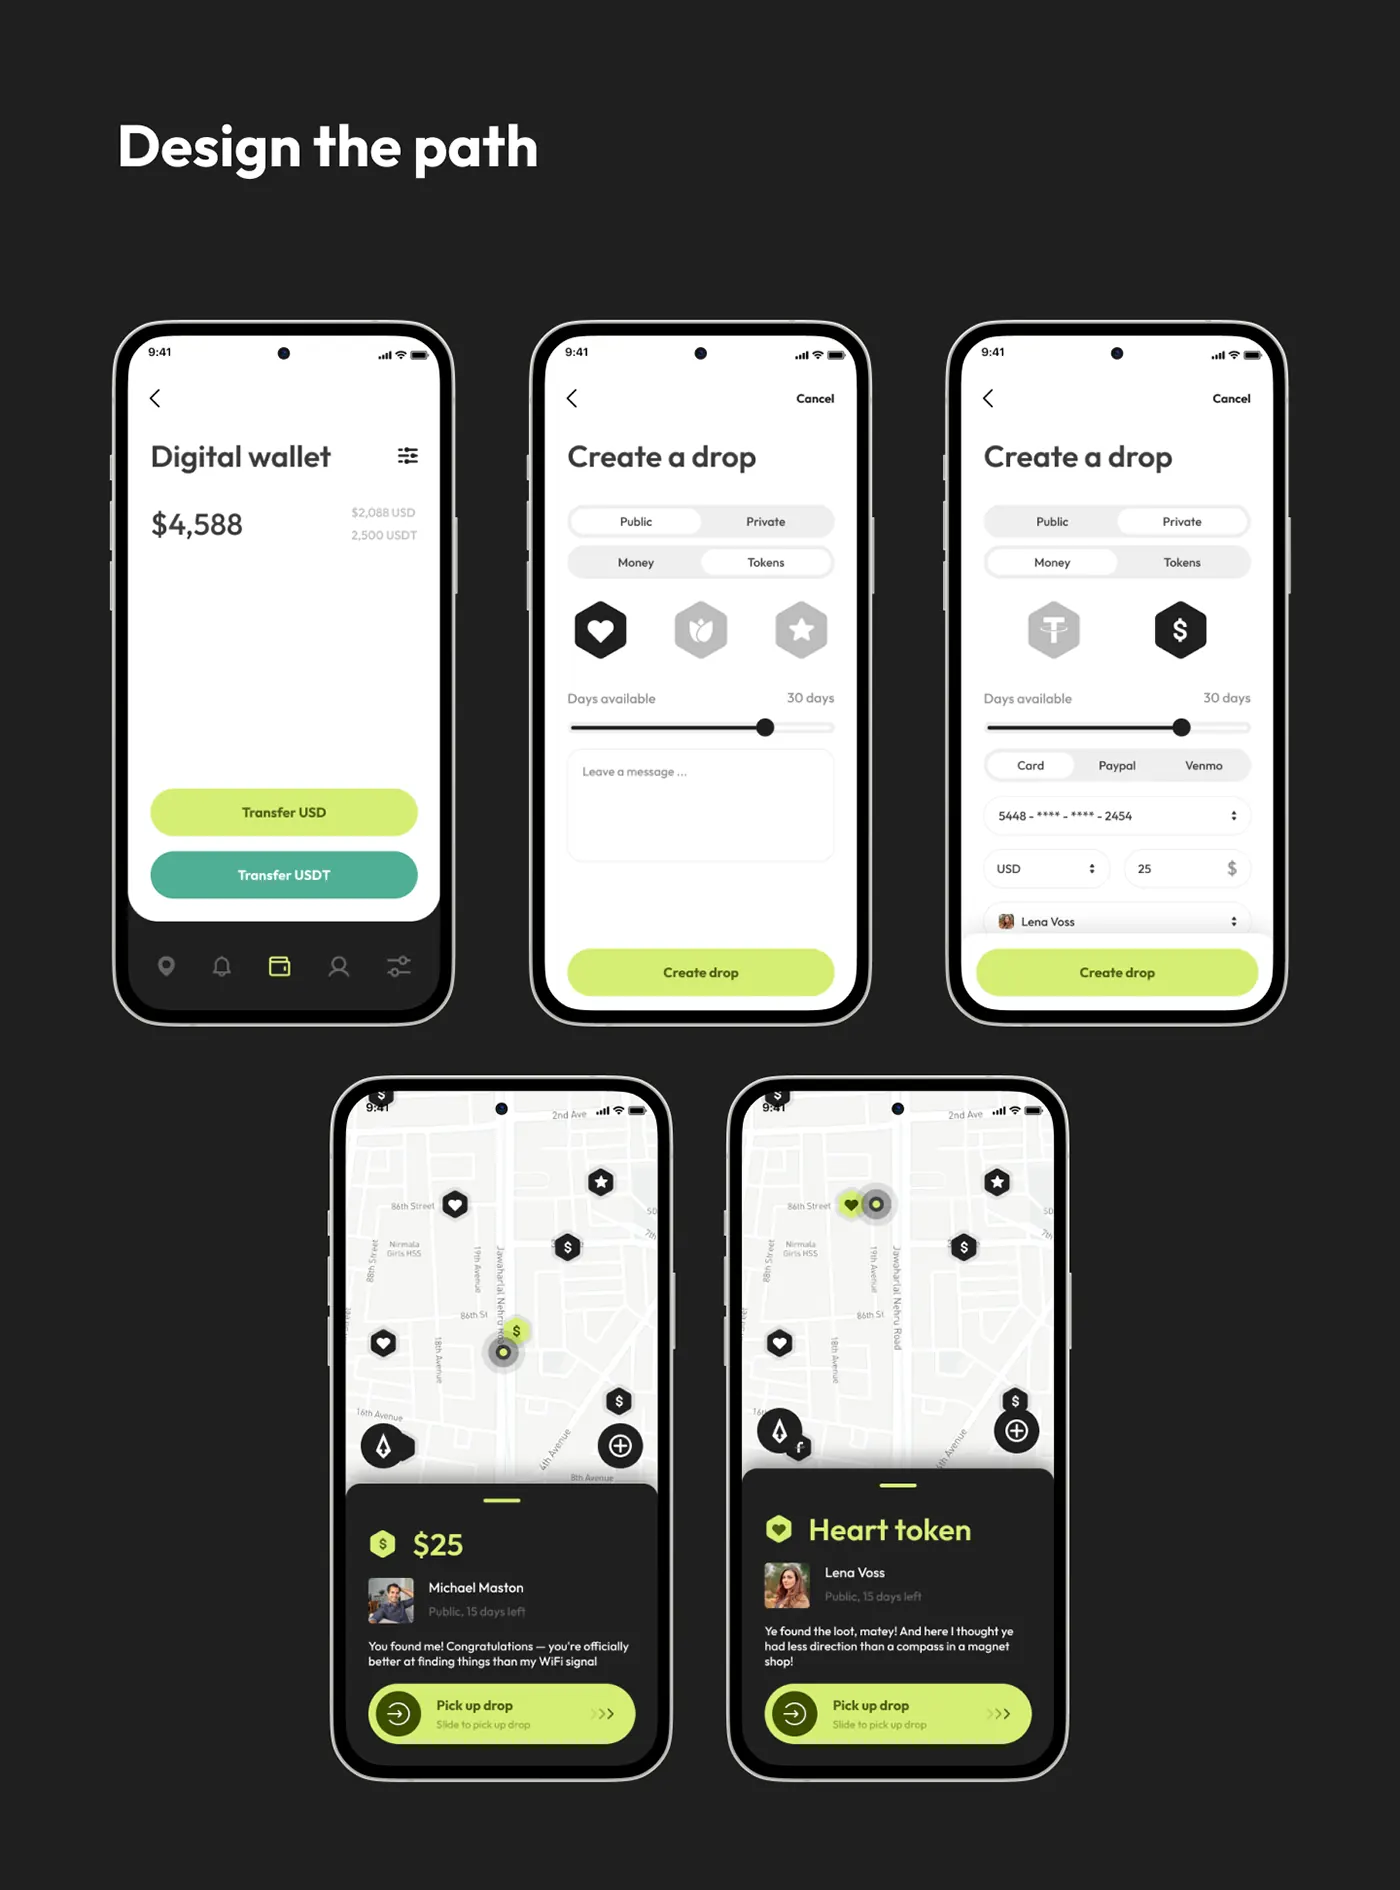
Do: use a control that takes intent. In Glimpse, picking up a drop uses a slide control and ends on “You received $25”.
Show movement, not just totals
Don’t: lead with one big number that hides the direction.
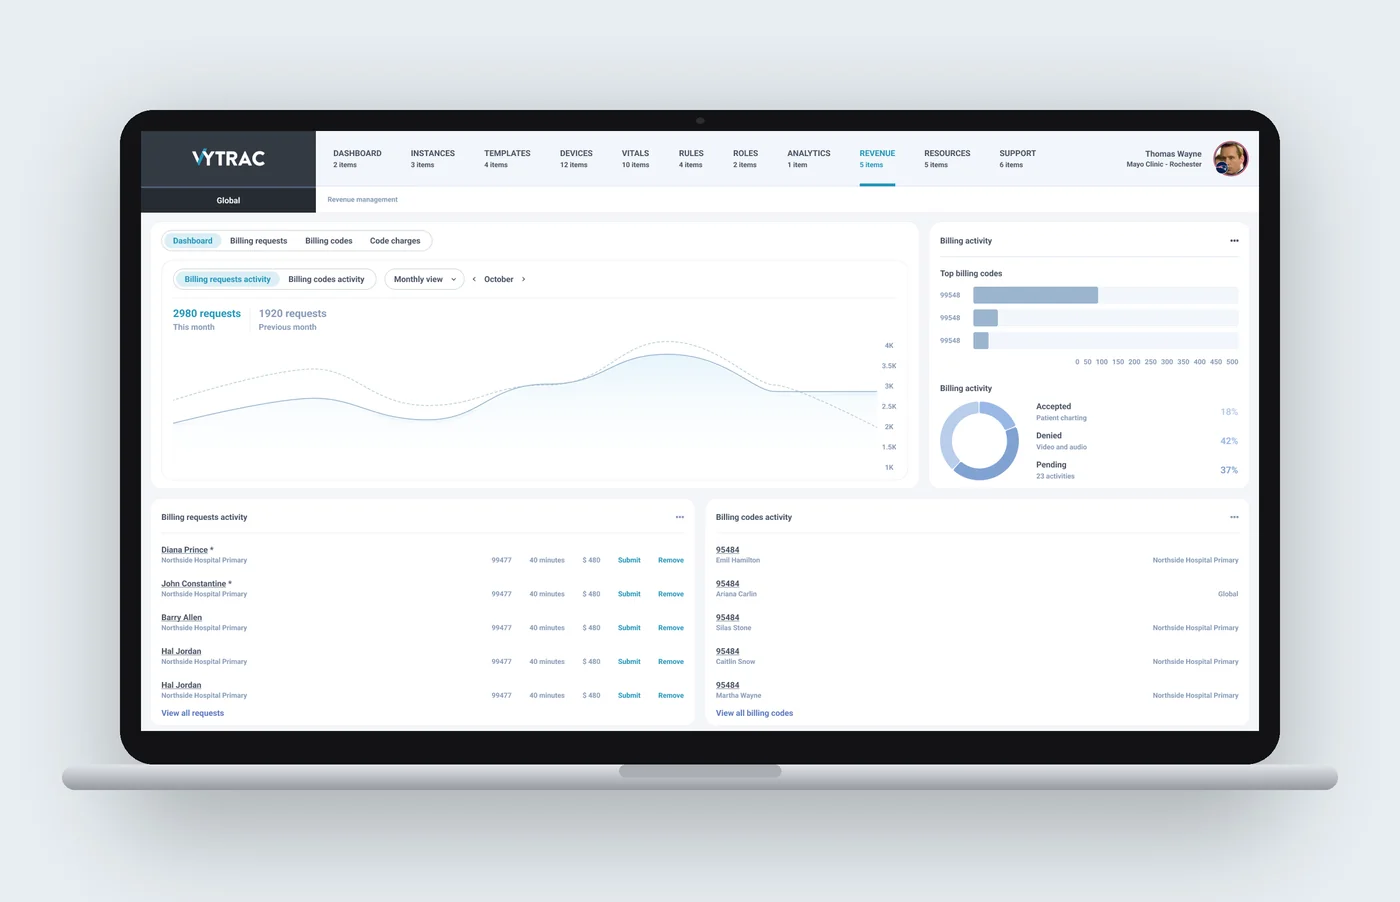
Do: show flow over time. Vytrac’s revenue screen tracks billing requests from ready to submitted to approved, not just a total.
Give each series its own lane
Don’t: stack every metric on one chart with two axes.
Do: separate series and mark what matters, the way Vytrac’s timeline marks where readings cross a limit.
Keep colour for status
Don’t: use colour as decoration, so red means both brand and a failed payment.
Do: keep the canvas calm and save strong colour for status, as in Zentra’s white cards and pastel data colours.
Let tables filter themselves
Don’t: open on a long, unfiltered table.
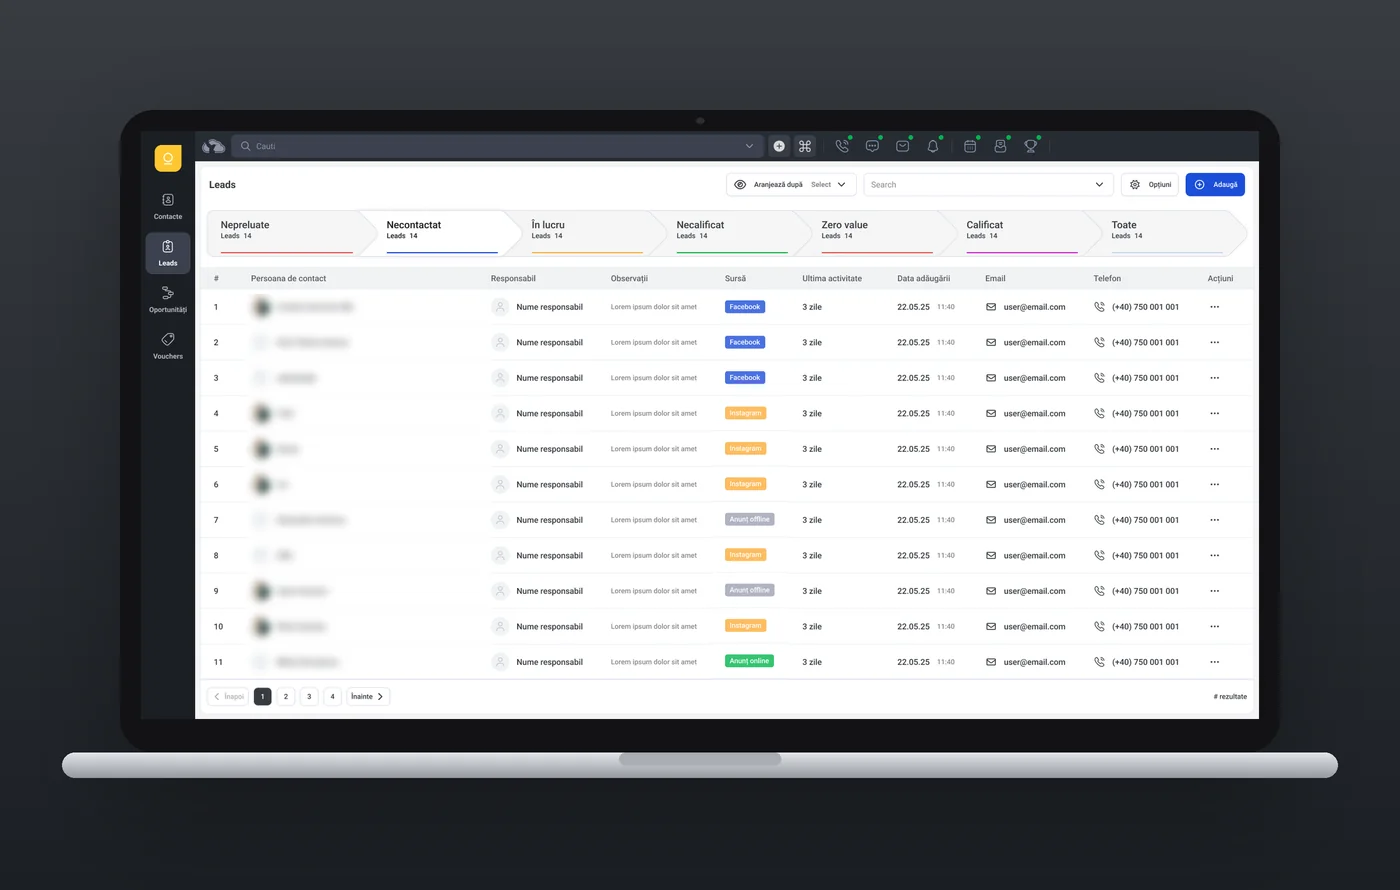
Do: put the state of the work above it. In Plinth CRM, pipeline steps with counts filter the table below; for payments, that’s pending, settled and failed.
The fix is usually the same: find the one decision a screen supports, put the number behind it first, and move the rest one tap away. See UI/UX design and UX audits.
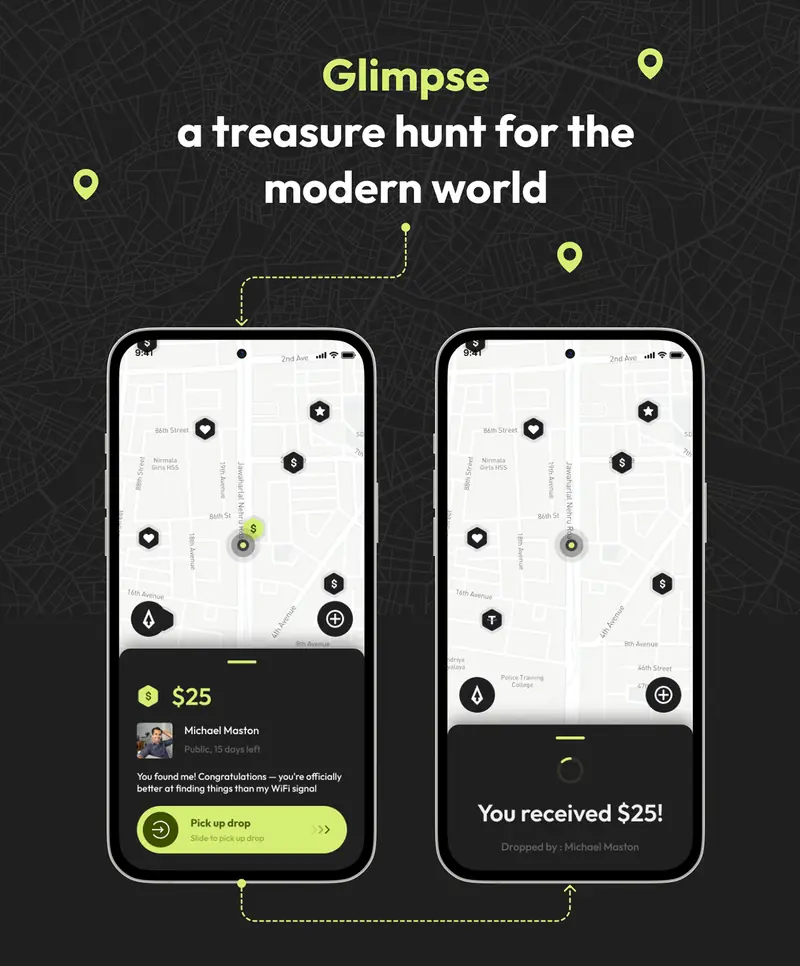
A treasure hunt for the modern world: drops of crypto and prizes hidden around the city.
Interactive prototype
Doctors see at a glance whether a patient is getting better.
Interactive prototype
A sales CRM built on a token-based design system: one set of colours, type, spacing and components across every screen.
Questions about this work? Let’s talk it through.
Set a meeting