Designing an AI-enabled baseball streaming app: scoreXLT
AI-enabled baseball streaming with live games, chat, play-by-play analysis and team stats. How the sports mobile app was designed, phase by phase.
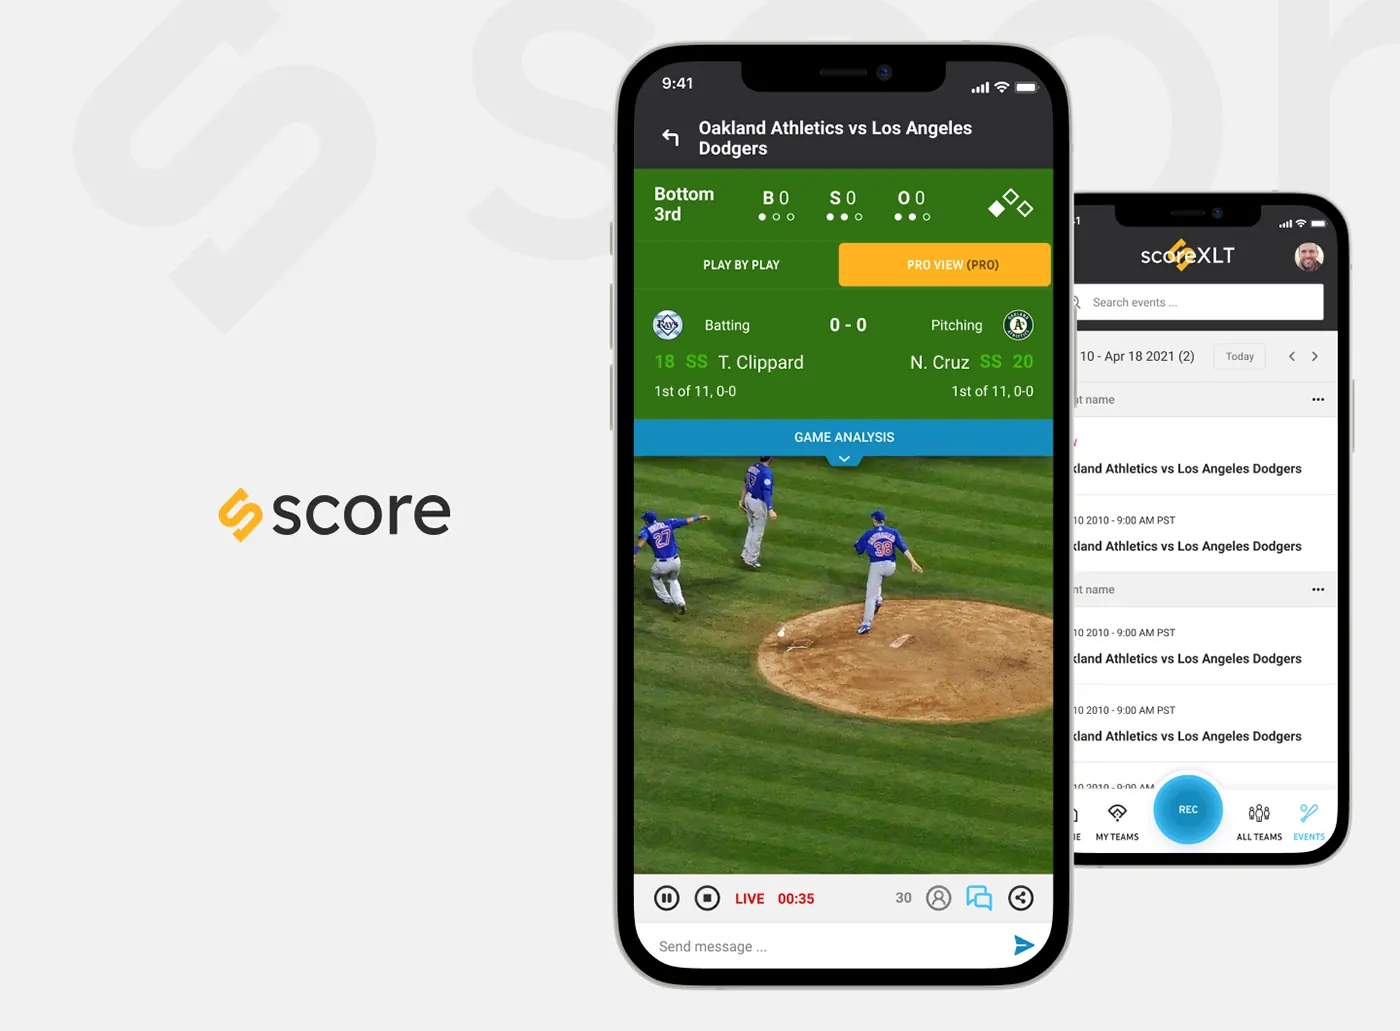
AI-enabled baseball streaming with live games, chat, play-by-play analysis and team stats.
Project at a glance
- Product: scoreXLT, a sports mobile app
- Platform: Mobile
- Software: Figma, Photoshop, Illustrator
- Design system: Charcoal headers, field green and orange-blue accents in Material-style lists and tabs
The challenge
Fans and teams wanted to experience baseball beyond the broadcast: live games, detailed stats and play-by-play in one app.
The UX approach
The work moved through 6 phases: structure, live stream, game analysis, logging plays, teams and events and visual system.
1. Structure
The problem. The app had to serve fans watching games and teams recording them, two jobs that could easily crowd each other.
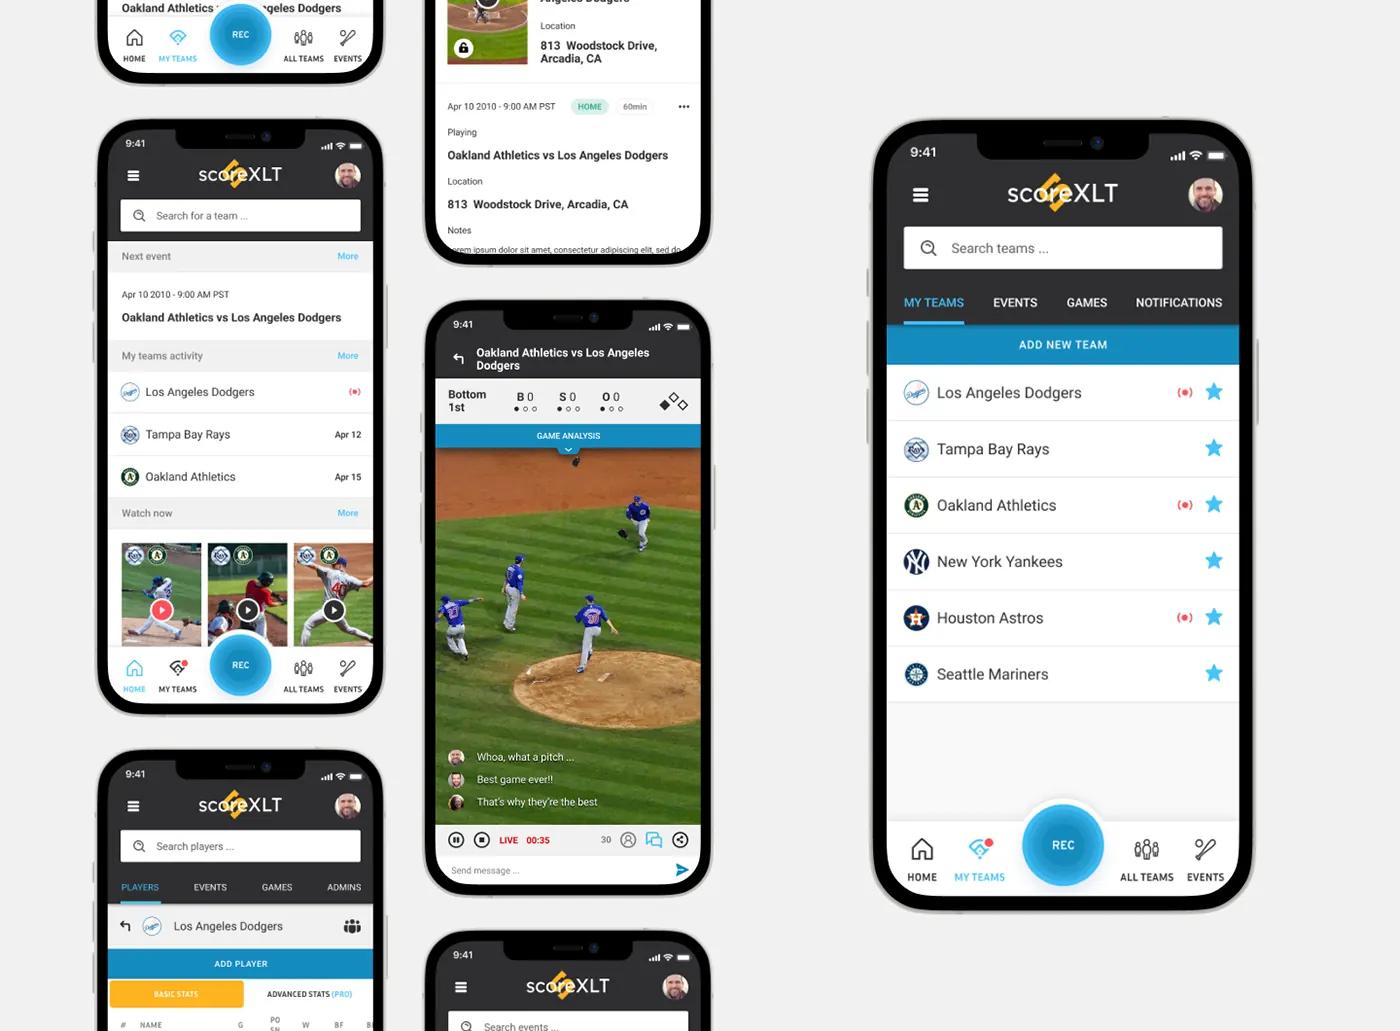
The solution. Split navigation into Home, My Teams, All Teams and Events. Recording got its own central REC button so it never hides inside a menu.
2. Live stream
The problem. Score, count and chat all compete with the video on a phone screen.
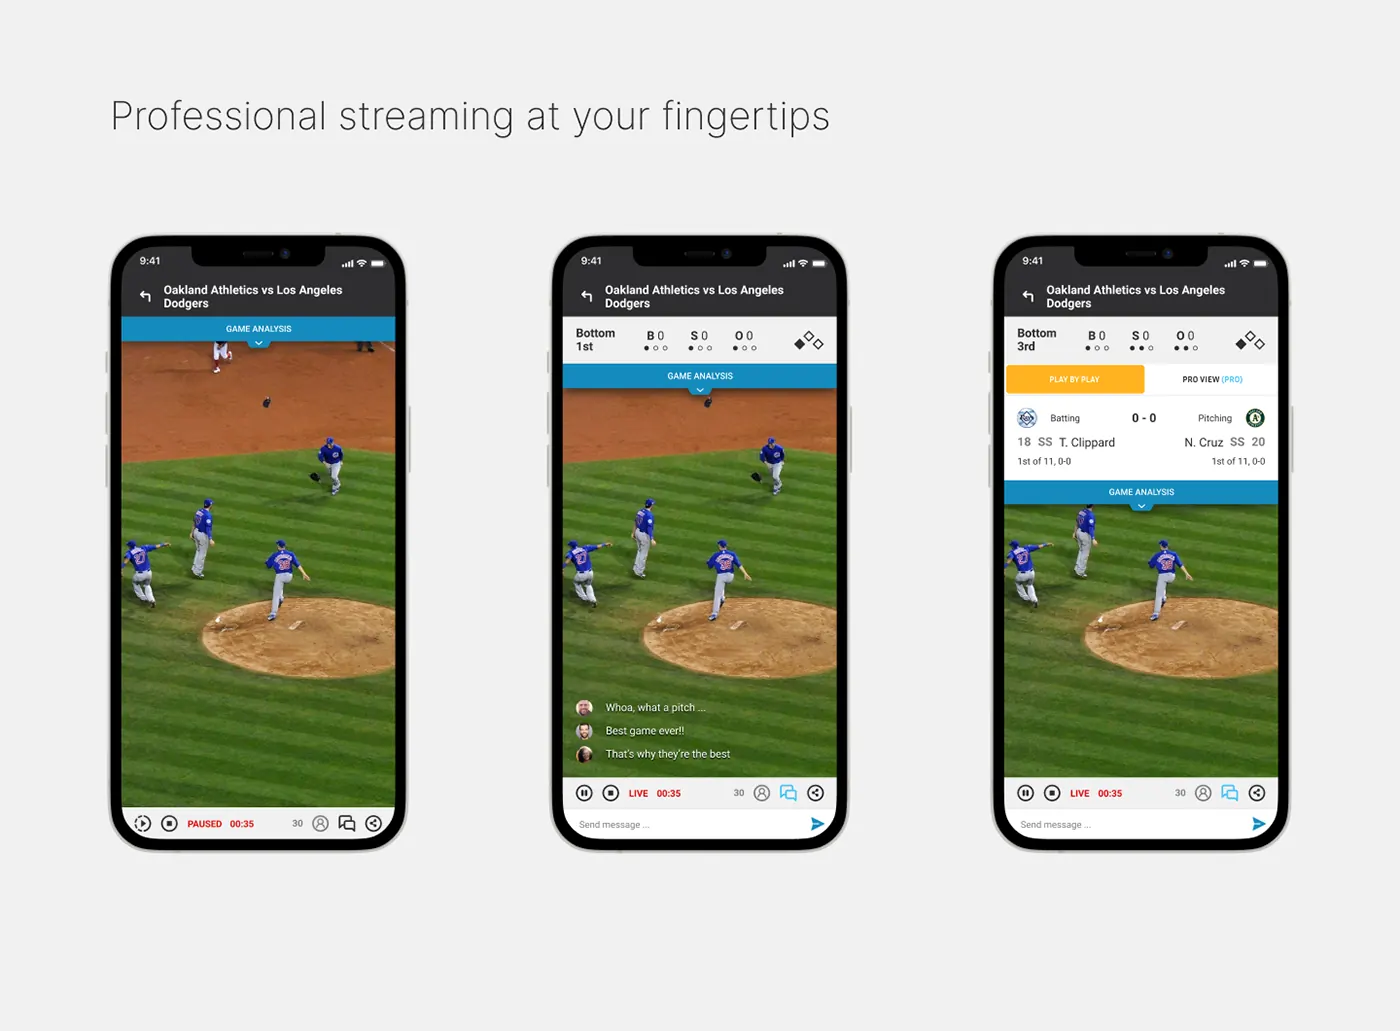
The solution. Pinned a compact scoreboard with inning, balls, strikes, outs and base runners above the stream. Chat floats over the lower field and playback controls sit in one bottom bar.
3. Game analysis
The problem. Fans wanted detail on each play without leaving the broadcast.
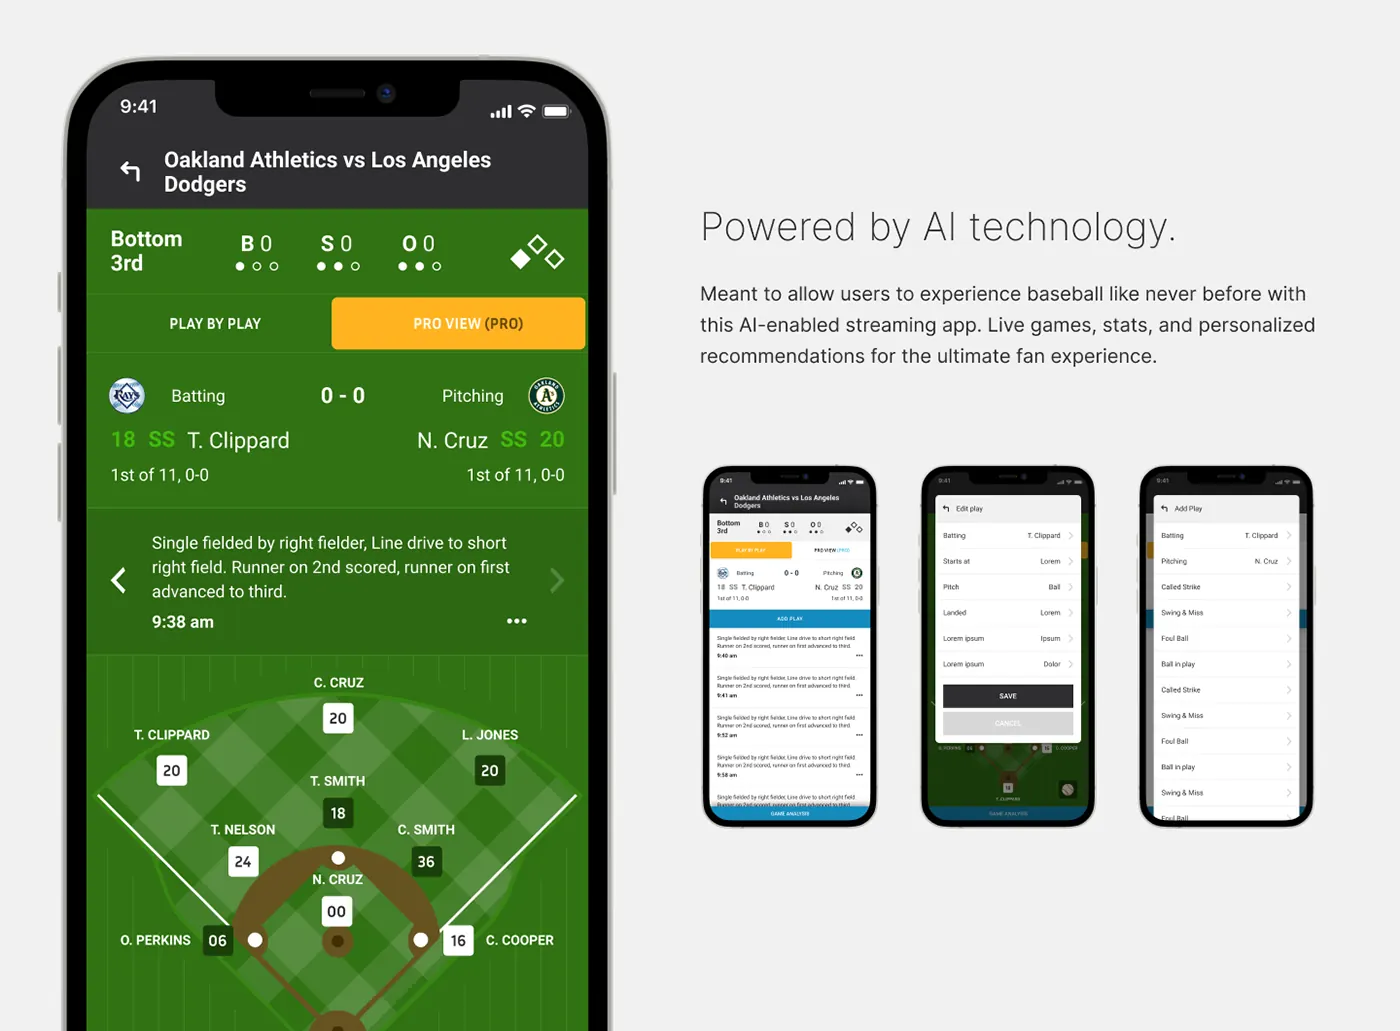
The solution. Added a Game Analysis drawer under the scoreboard with batter and pitcher up now, a Play by Play feed, and a Pro View field diagram placing every fielder by name and number.
4. Logging plays
The problem. Play data comes from people at the field, who need to enter it quickly mid-game.
The solution. Designed Add Play and Edit Play as short tappable lists such as Called Strike, Swing & Miss, Foul Ball and Ball in play, instead of free text.
5. Teams and events
The problem. Rosters, schedules and stats span many teams and dates, which gets hard to scan.
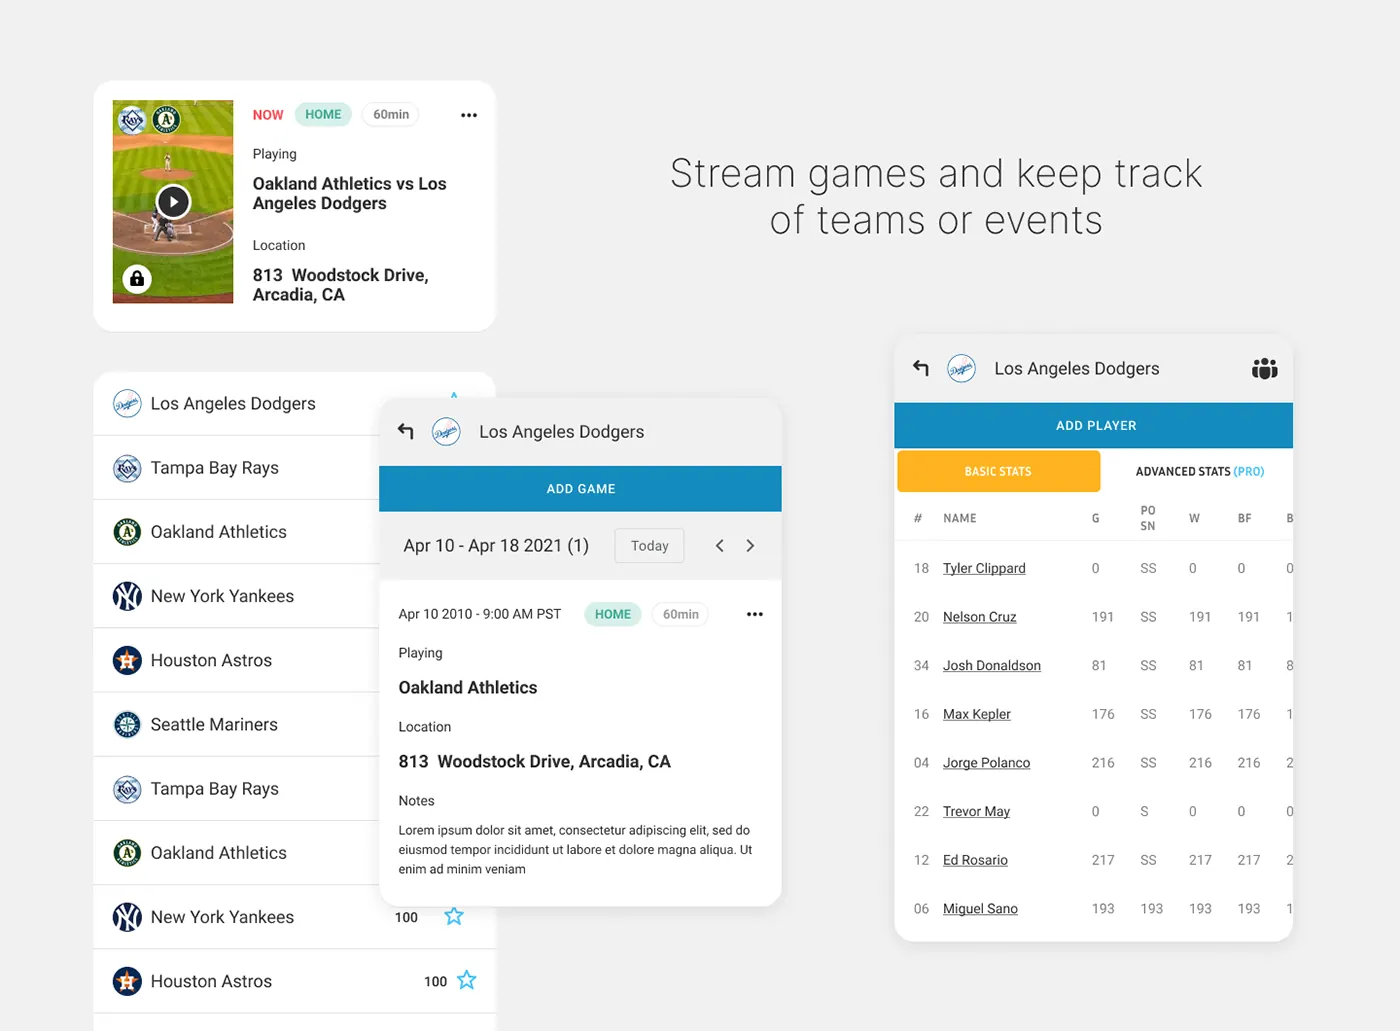
The solution. Team pages hold Add Player, Add Game and a week-by-week event calendar. Rosters split into Basic Stats and Advanced Stats, and followed teams show a live marker.
6. Visual system
The problem. Free and paid features needed to be told apart without extra labels everywhere.
The solution. Kept charcoal headers and field green for game context, blue for actions, and reserved orange for Pro features like Pro View and advanced stats.
What the product does
- Live streaming with chat
- Play-by-play and Pro View analysis
- Team rosters and advanced stats
- Live scoreboard overlay

The design system
Charcoal headers, field green and orange-blue accents in Material-style lists and tabs. The design library on the project page rebuilds the live count bar, play-by-play row, live stream controls and chat overlay message as components with their variants.
The outcome
An interactive prototype of the live stream, the game analysis drawer and play logging, and a Material-style design system that tells free and paid features apart for fans and teams.
Questions about this work? Let’s talk it through.
Set a meeting